Turn a photo into a printable pixel chart
Pixelate any image, reduce it to a clean set of colours, and export a numbered design chart on tiled A4 — ready for cross-stitch, beads, or perler patterns. Or flip to retro block art for a game-style PNG. Everything runs in your browser.
Try it nowNo AI. Accurate algorithmic pixelation and colour reduction. Your image is never uploaded.
Output
Pixel resolution
Horizontal block count. The vertical count follows the image proportions.
Block colour
Colours
Median-cut quantization picks the most representative colours.
Dithering
Chart overlay
The PDF tiles across A4 sheets at this cell size, with overlap margins and registration marks.
Colour legend
Export
Who uses PixelForge?
Anyone turning an image into a grid of coloured blocks — to make or to play.
Cross-stitch, beads & perler
Convert a photo into a numbered chart with a colour legend and bold every-10 guide lines, then print it across tiled A4 sheets to follow stitch by stitch.
Pixel & game artists
Drop the chart and switch to retro block mode for a clean, hard-edged pixel-art PNG at a fixed colour count, dither and all.
Mosaic & wall projects
Plan a tile mosaic, sticky-note wall, or paint-by-block mural from a known palette and an exact block grid you can print to scale.
Frequently Asked Questions
Is my image uploaded to a server?
No. Pixelation and colour reduction happen entirely in your browser using the Canvas API. Your image is never sent to any server, and closing the tab discards it.
What is the difference between the two modes?
Both modes share the same pixelation and colour reduction. Design chart adds a numbered grid and a colour legend and exports a printable, tiled A4 PDF or a chart PNG. Retro block mode hides the grid and numbers and exports a clean, hard-edged block PNG.
How are the colours chosen?
PixelForge reuses the same median-cut quantization as PaletteForge to pick a representative palette at the count you set, with optional Floyd–Steinberg or ordered dithering. Dithering is off by default because a chart reads best with flat fills.
How does the printable chart fit on A4?
You set the printed size of one cell in millimetres. PixelForge tiles the chart across as many A4 sheets as needed, with overlap margins and corner registration marks, plus a colour legend page — the same tiling approach as TraceGrid.
Is PixelForge free?
Yes, completely free. No account required, no usage limits, no watermarks.
How to Use PixelForge
From photo to chart in 3 steps
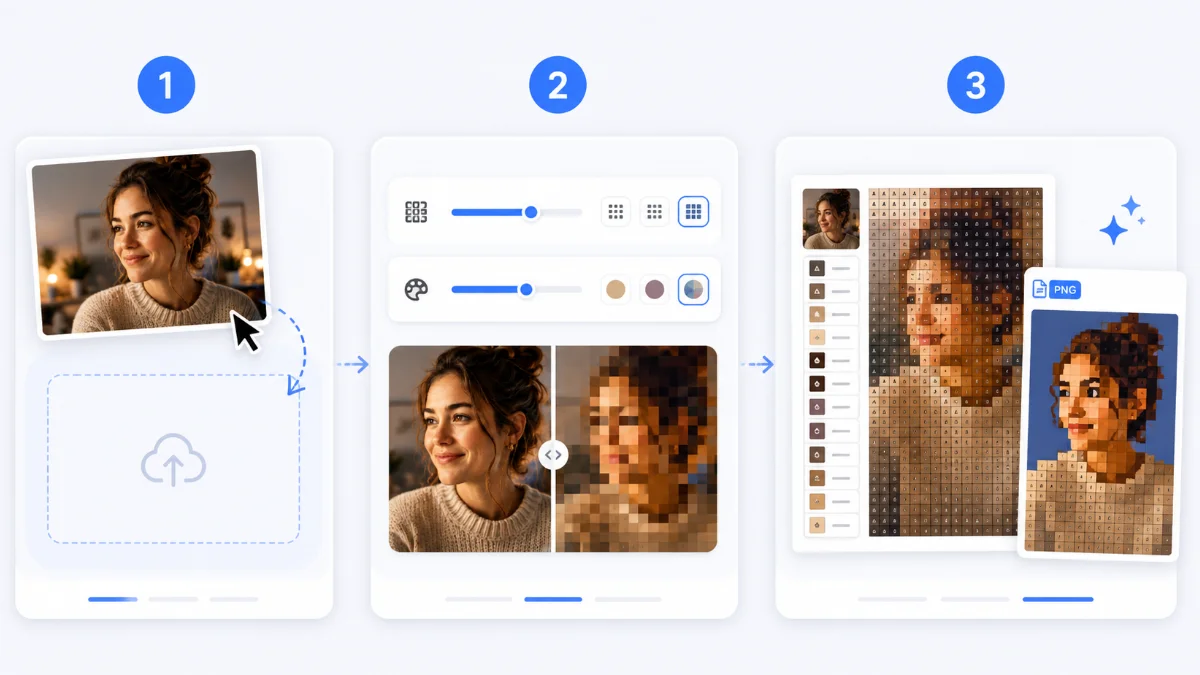
- Load an image — drop a file, pick one, or paste from the clipboard. Nothing is uploaded; processing is local.
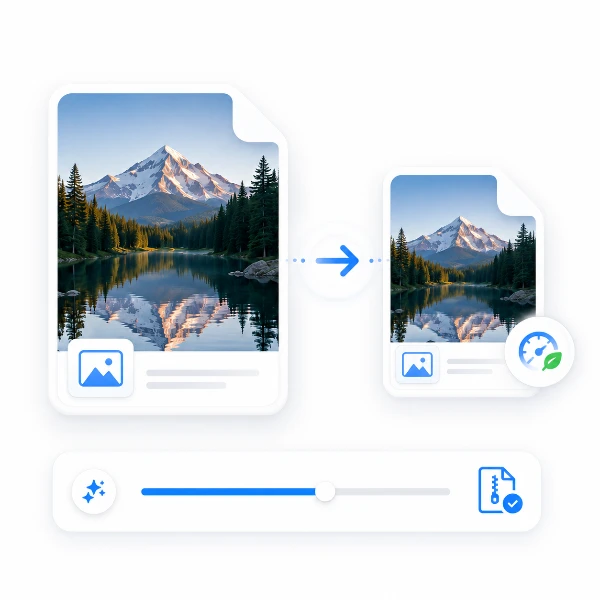
- Set the pixel resolution and colour count, then compare the result against the original with the slider. Dithering is optional.
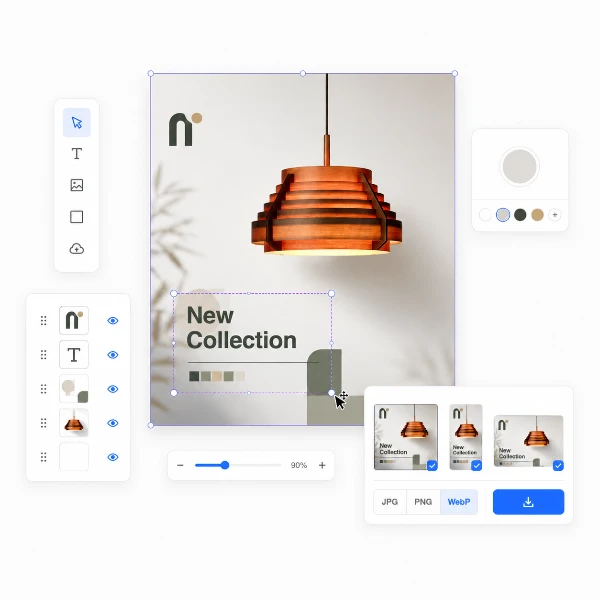
- Keep Design chart for a numbered, printable A4 PDF and legend, or switch to Retro block for a clean game-style PNG.
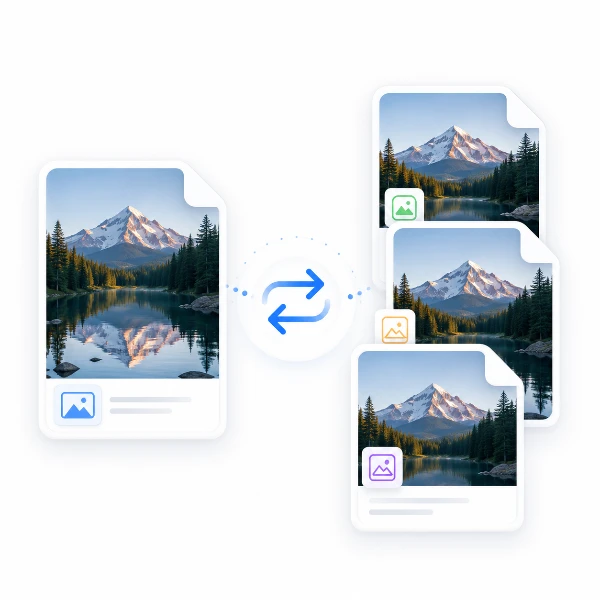
One engine, two outputs
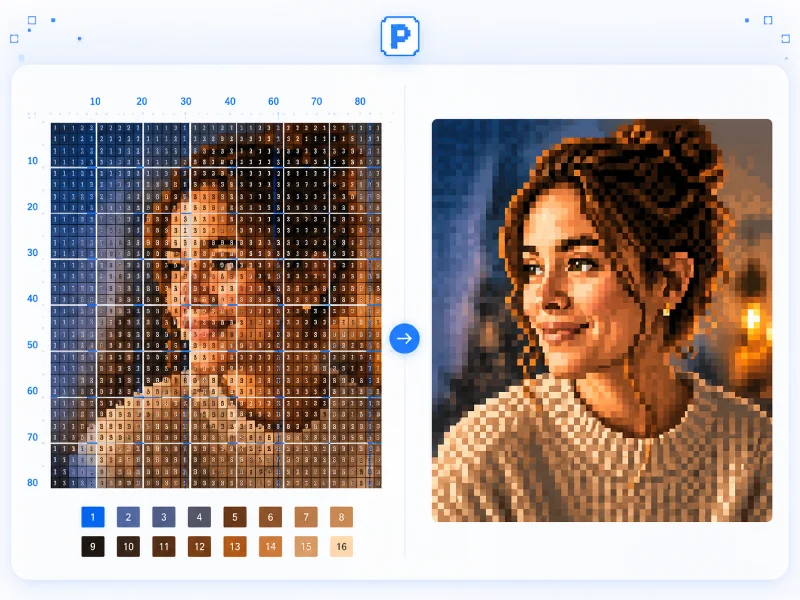
PixelForge runs a single pipeline — downsample to a block grid, then reduce to a precise palette — and presents the result two ways. The lead is the design chart: a numbered grid with a colour legend that you can print to exact scale, built for cross-stitch, bead, perler, and tile-mosaic projects. The retro block mode is the same pixels with the grid and numbers stripped away, exported as a crisp game-style PNG.
Because both modes come from the same reduction, switching between them never changes the colours or the layout — only how the result is presented and exported. You can dial in the look once and take it to the wall or to the screen.
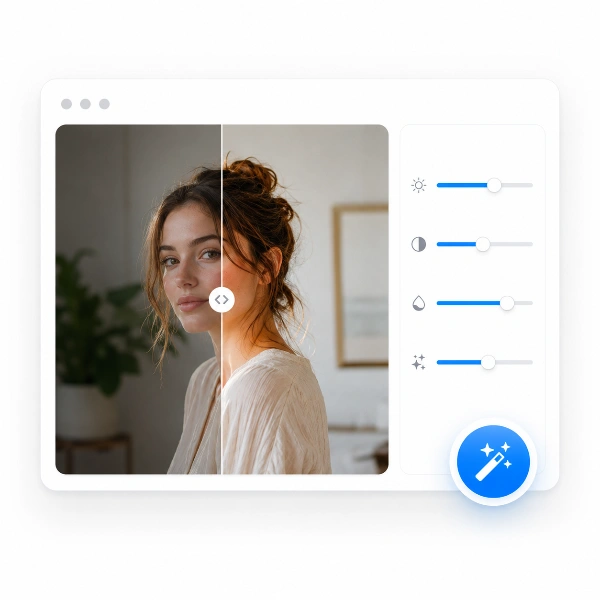
Resolution and colour control
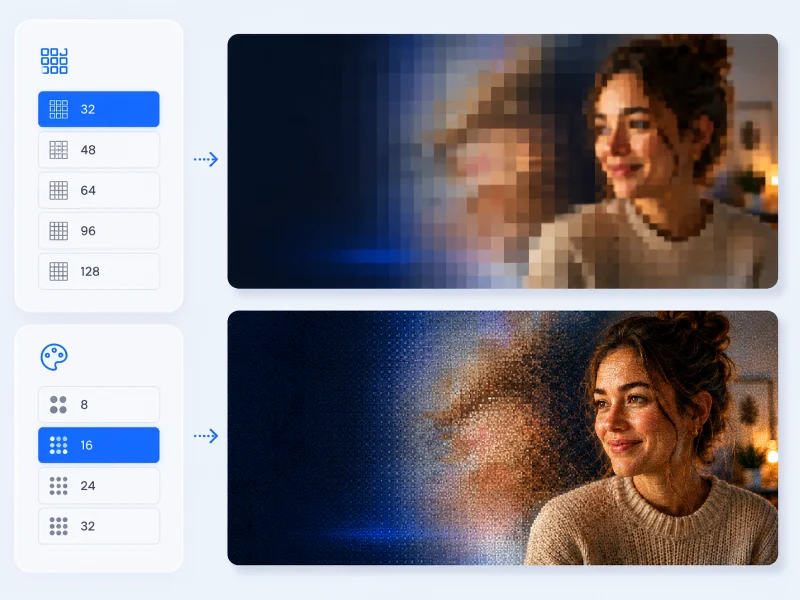
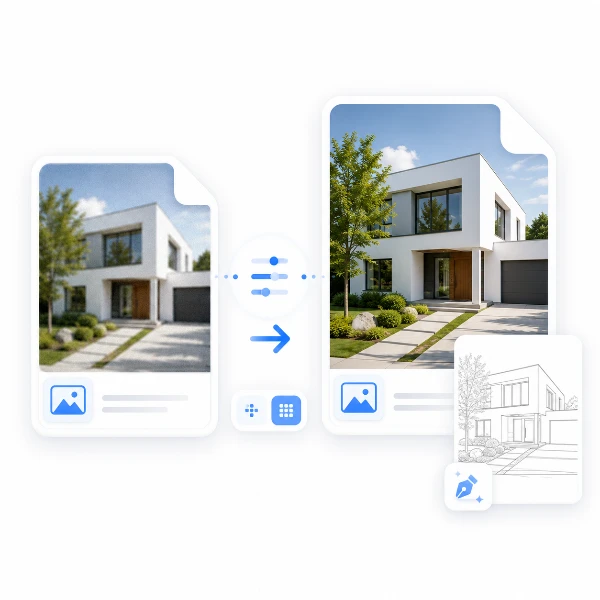
Choose how many blocks span the width — from a chunky 32 up to a detailed 128 or any custom value — and the height follows the image's proportions automatically. Pick how each block's colour is decided: average for smooth photographic results, or median for crisper edges and flatter areas. Then reduce to 8, 16, 24, 32, or any count from 2 to 256 with median-cut quantization.
Dithering stays off by default so a chart reads cleanly with flat fills, but Floyd–Steinberg and ordered Bayer modes are a click away when you want smoother gradients or a deliberately retro grain. Every change re-renders instantly in the before/after slider.
Printable, tiled across A4
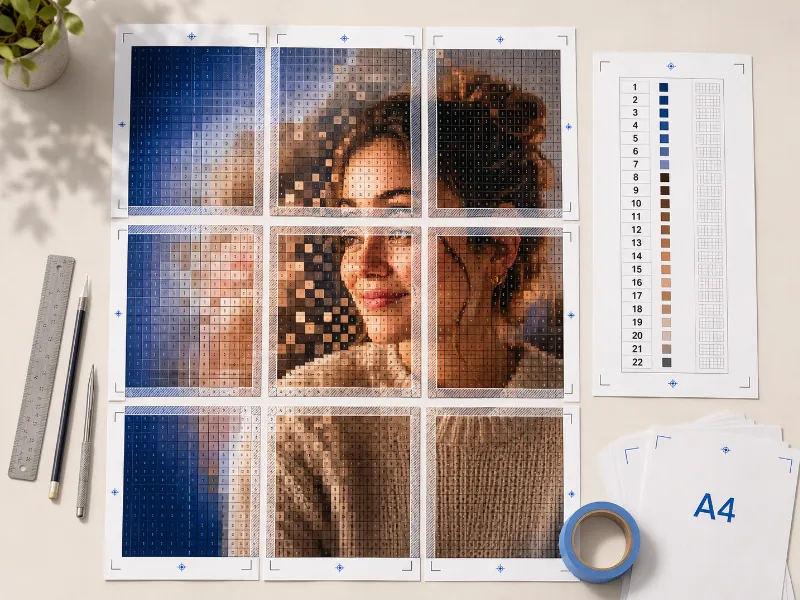
Set the printed size of a single cell in millimetres and PixelForge lays the chart out across as many A4 sheets as it needs, with overlap margins and corner registration marks so the pages tape together cleanly. Bold guide lines every ten cells help you keep your place, and a colour legend page lists each number, its HEX value, and how many cells use it.
Export a print-ready PDF, a single high-resolution chart PNG, or — in retro block mode — a clean pixel PNG. The tiling math mirrors TraceGrid, so the printed scale is exact.
Privacy: your image never leaves your device

PixelForge processes images entirely in your browser using the Canvas API. No file is transmitted to any server, which makes it safe for confidential or unreleased artwork. Reload the page and everything is gone — nothing was ever sent anywhere.